
Lower cost
Reduce avoidable labor, downtime, duplicated tools, and manual reporting.

Platform · Pion
One operational view—from global condition to company, site, system, and root device.
The platform's own labels: filled where every row is a record it wrote, hollow where the estate is simulated.
Reduce avoidable labor, downtime, duplicated tools, and manual reporting.
Turn fragmented signals into governed, device-level resolution workflows.
Add sites, assets, and clients without matching growth in coordination overhead.
01 / The difference
Pion is designed around business outcomes: healthier systems, shorter incidents, fewer repeat failures, lower support burden, stronger evidence, and more capacity to serve customers and expand operations.
02 / One surface
Instead of forcing technicians to jump between security tools, service desks, remote management systems, cloud portals, SCADA/OT consoles, and reporting documents, Pion is designed to bring those signals into a single command center.
Where the work is today
Each holds part of the answer. None holds the record. The operator carries the context between them by hand — the brief calls it swivel-chair work.
Where Pion puts it
Pion
One governed command layer
One surface, one context, one record. The operator sees which client, site or system needs attention, and is routed into the workspace that can act on it.
The single surface is built and captured on this page. The connectors that would feed it from those six systems are not built in this stage.
03 / Where Pion is going
These are NGCC5's design mockups of the operational pages — the control center, the four operational domains, executive reporting and settings — the destination, not a screenshot. Under each are the indicators the page is meant to monitor.
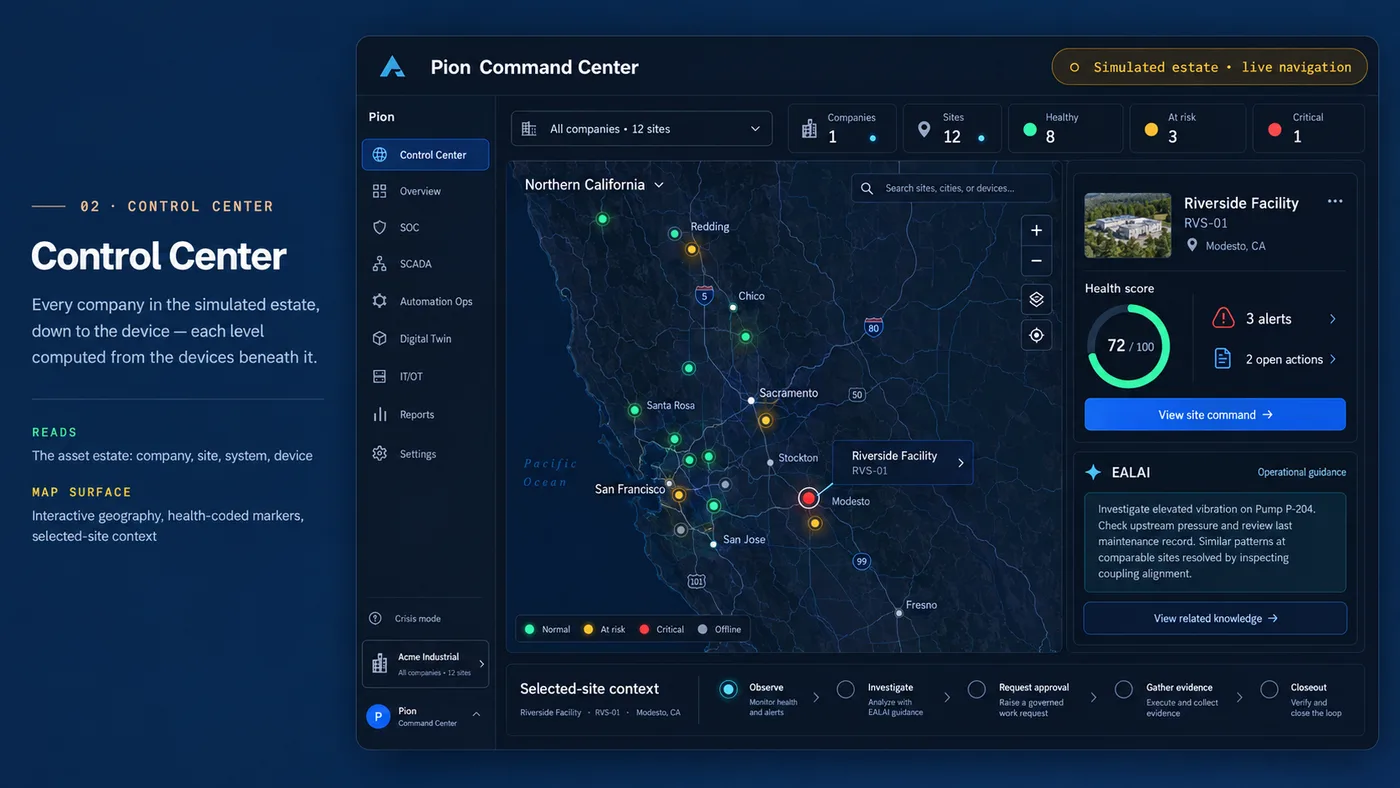
Control Center
Enterprise-wide operational visibility
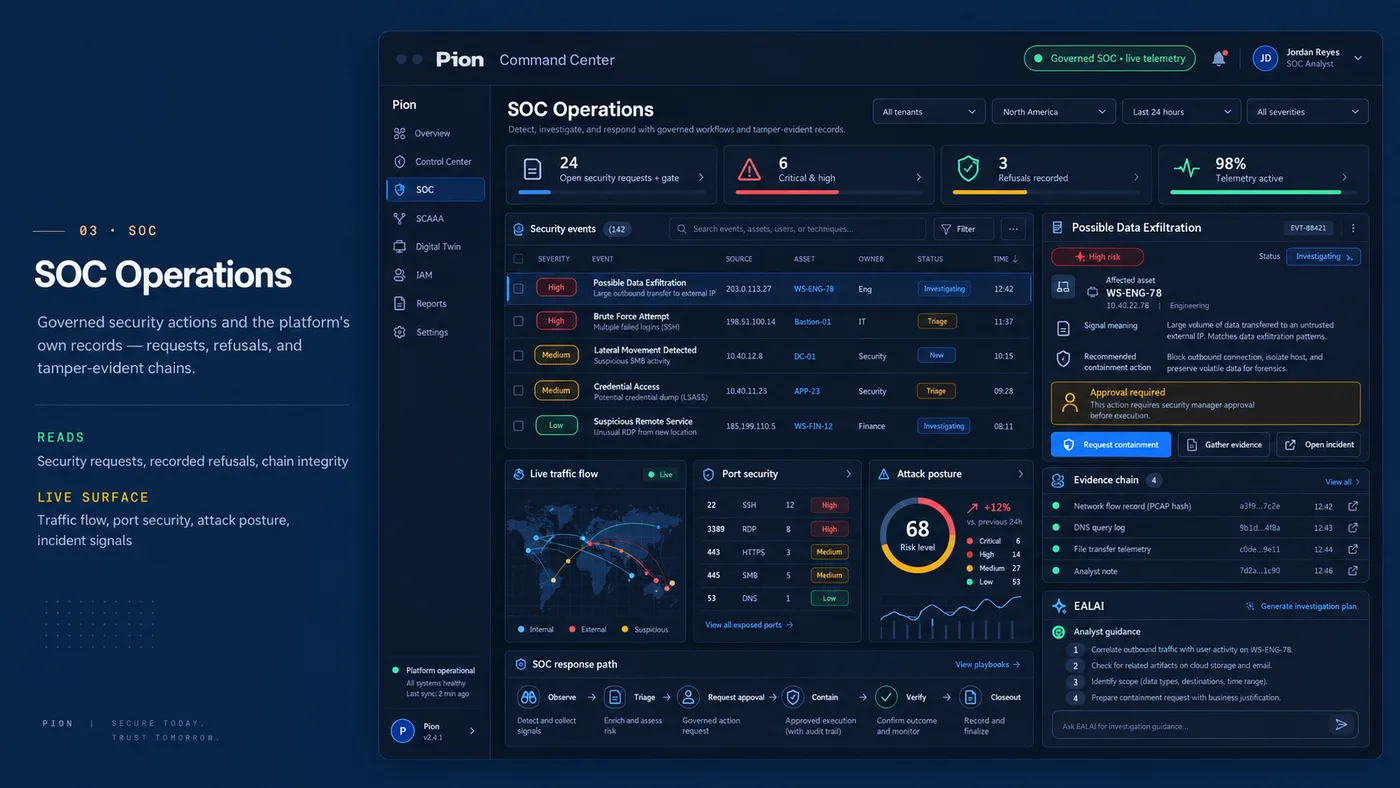
SOC Operations
Real-time security monitoring, detection, and response
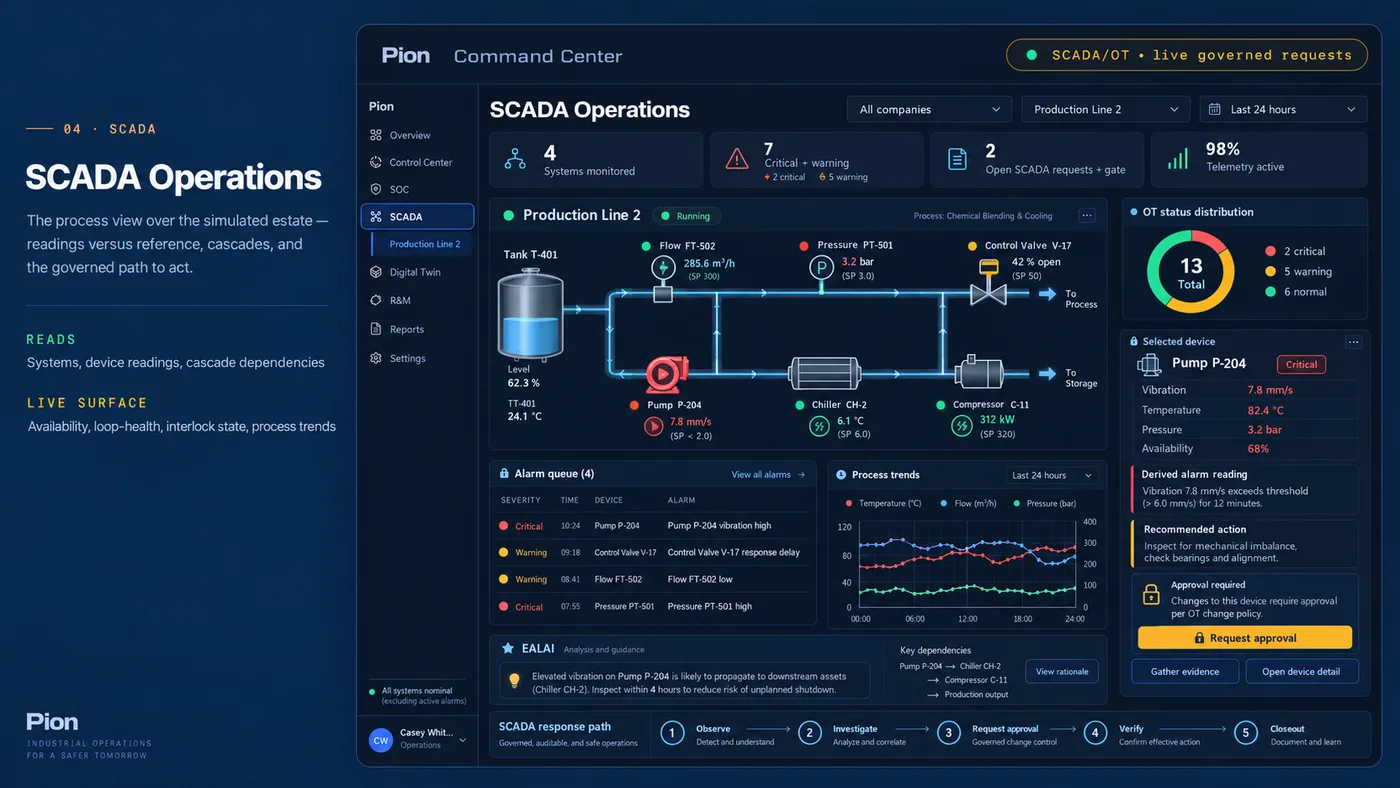
SCADA Operations
Process view and equipment status
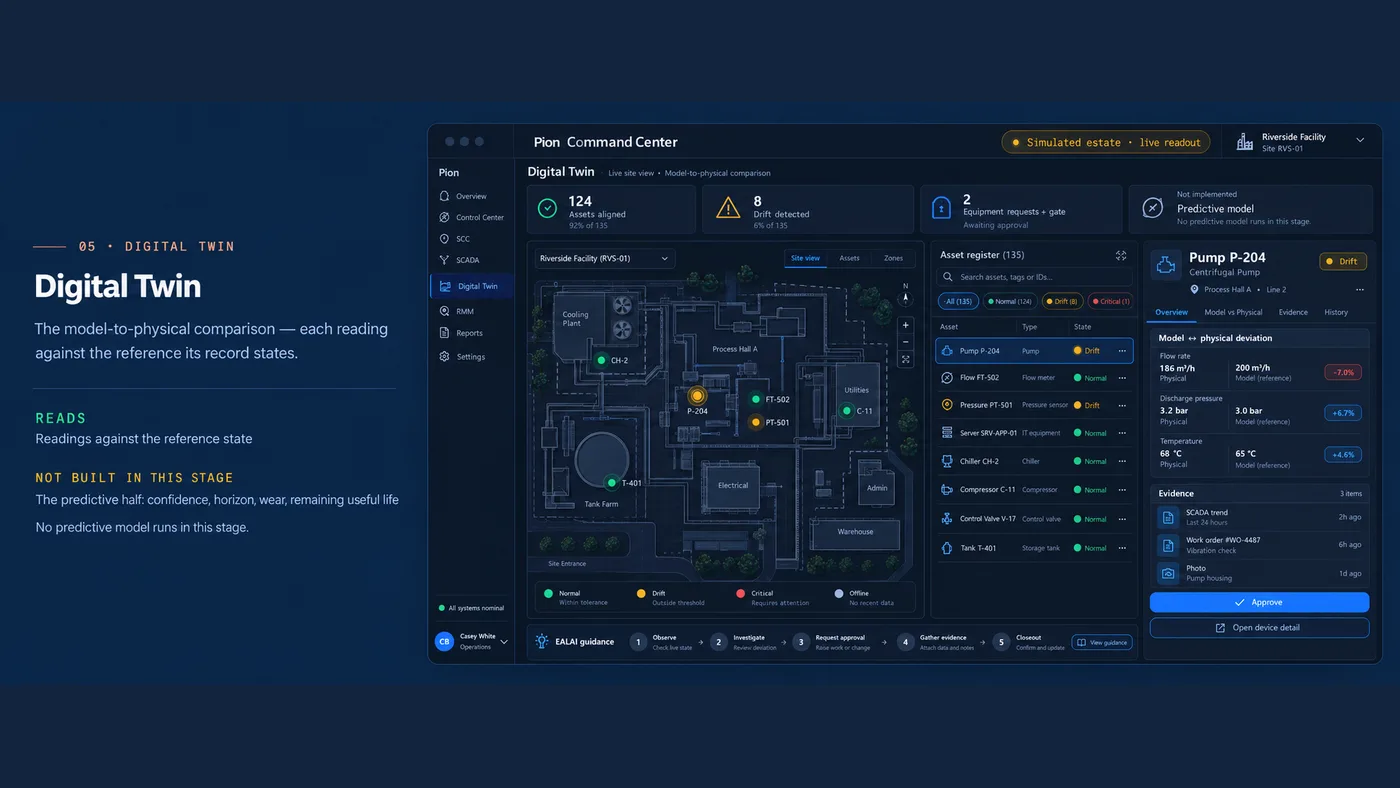
Digital Twin
Model-to-physical synchronization
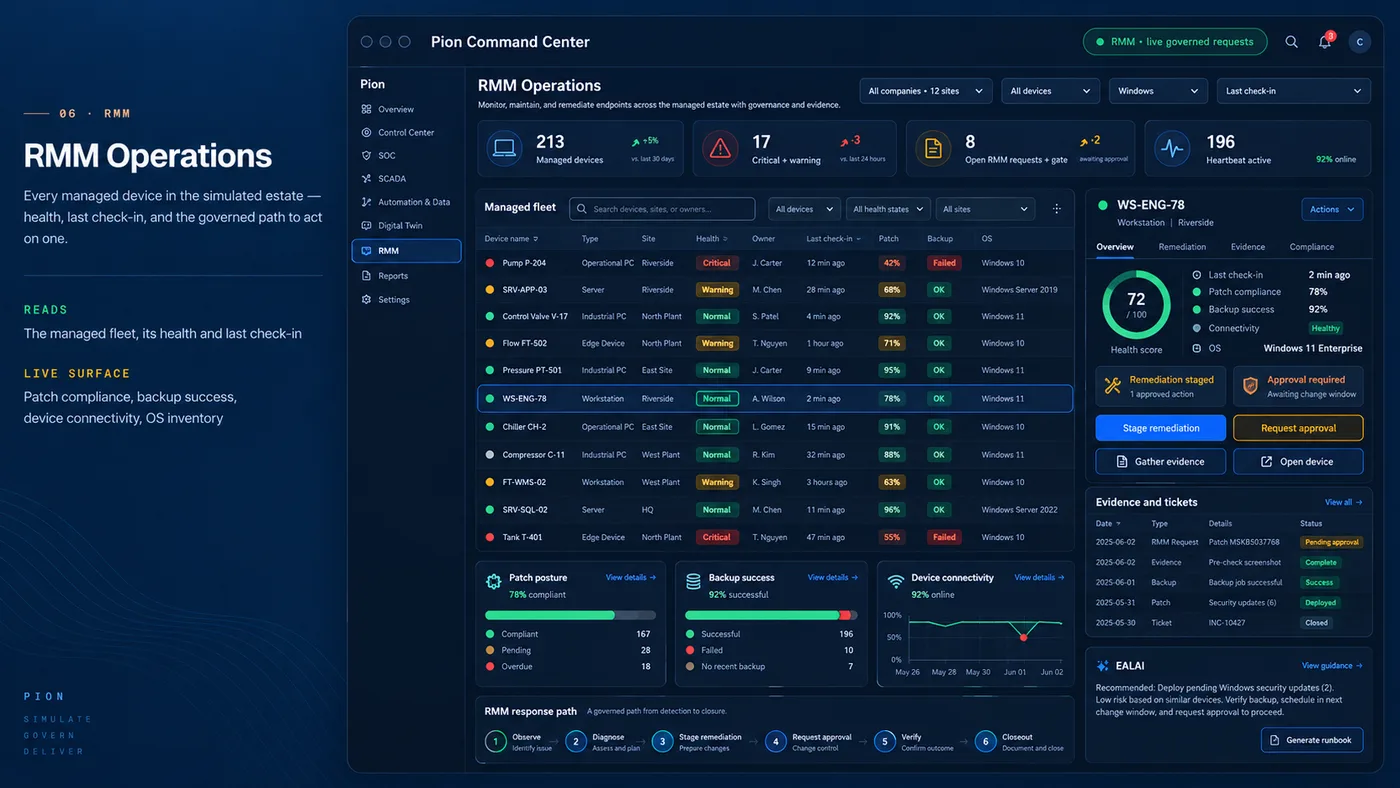
RMM Operations
Remote monitoring and management overview
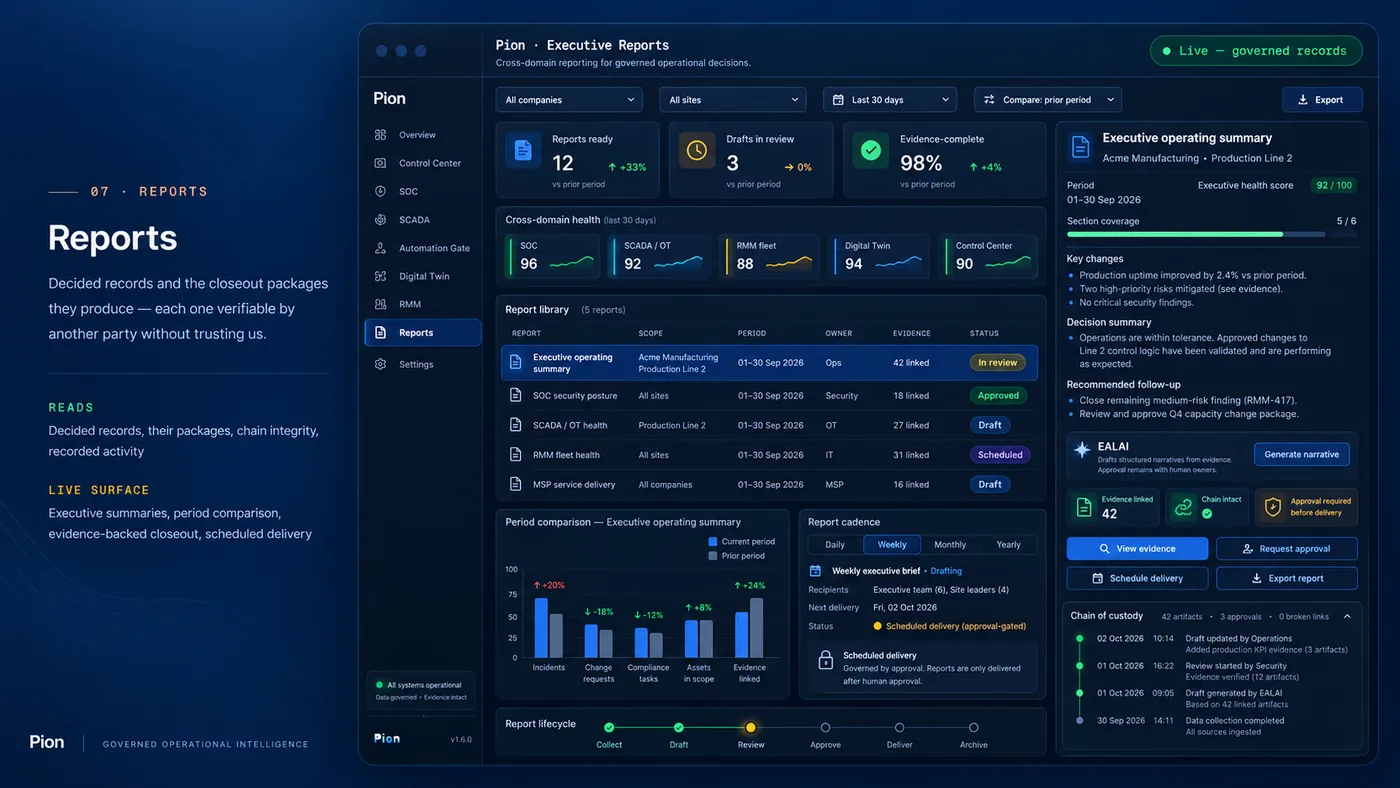
Executive Reports
Cross-domain reporting for governed operational decisions
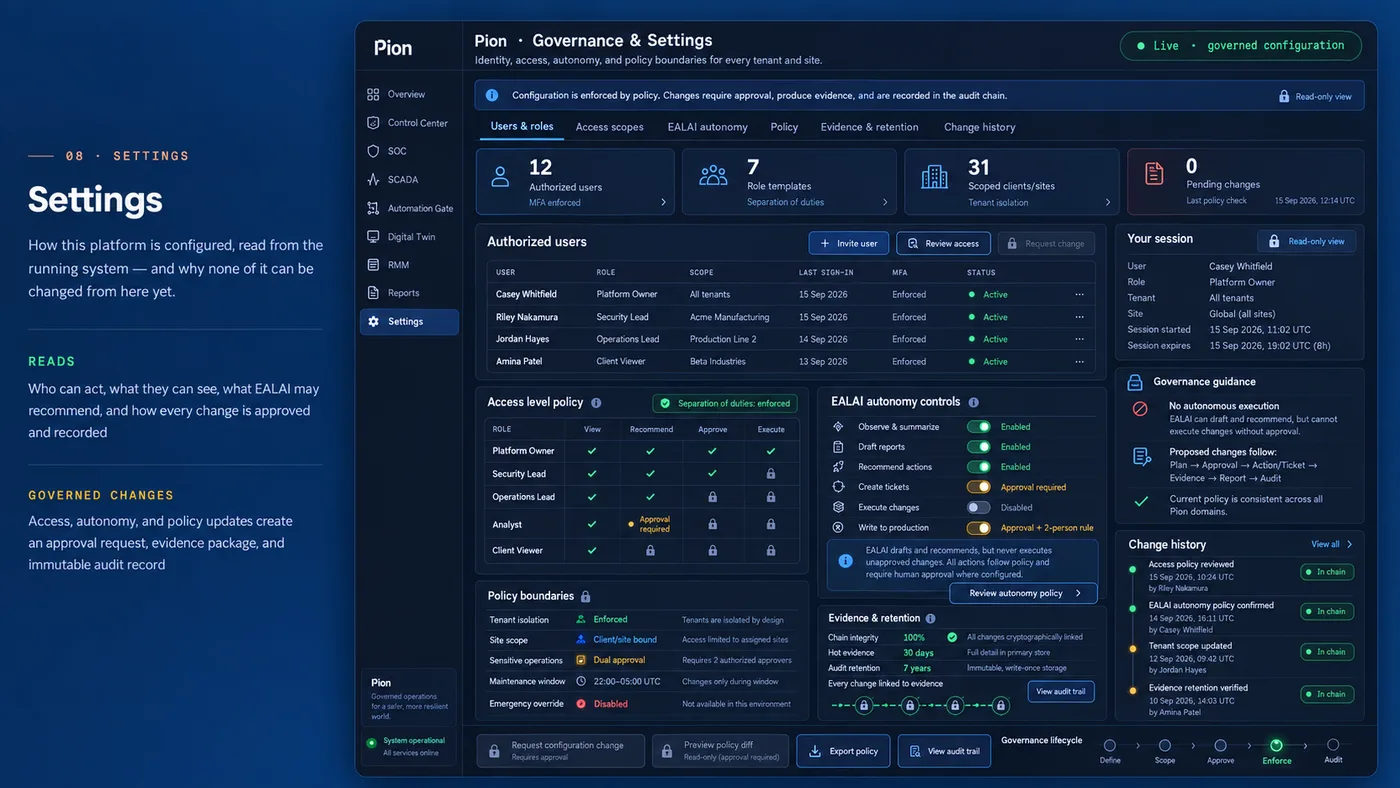
Governance & Settings
Identity, access, and policy boundaries for every tenant and site
NGCC5's later mockup sheet makes the digital twin a route rather than a destination: six views of the same estate, each one a layer closer to the device that has the problem — the plant in three dimensions, the service topology, the site, the process loop, the incident replayed against its own timeline, and the portfolio a board would read. Every panel is a design mockup.
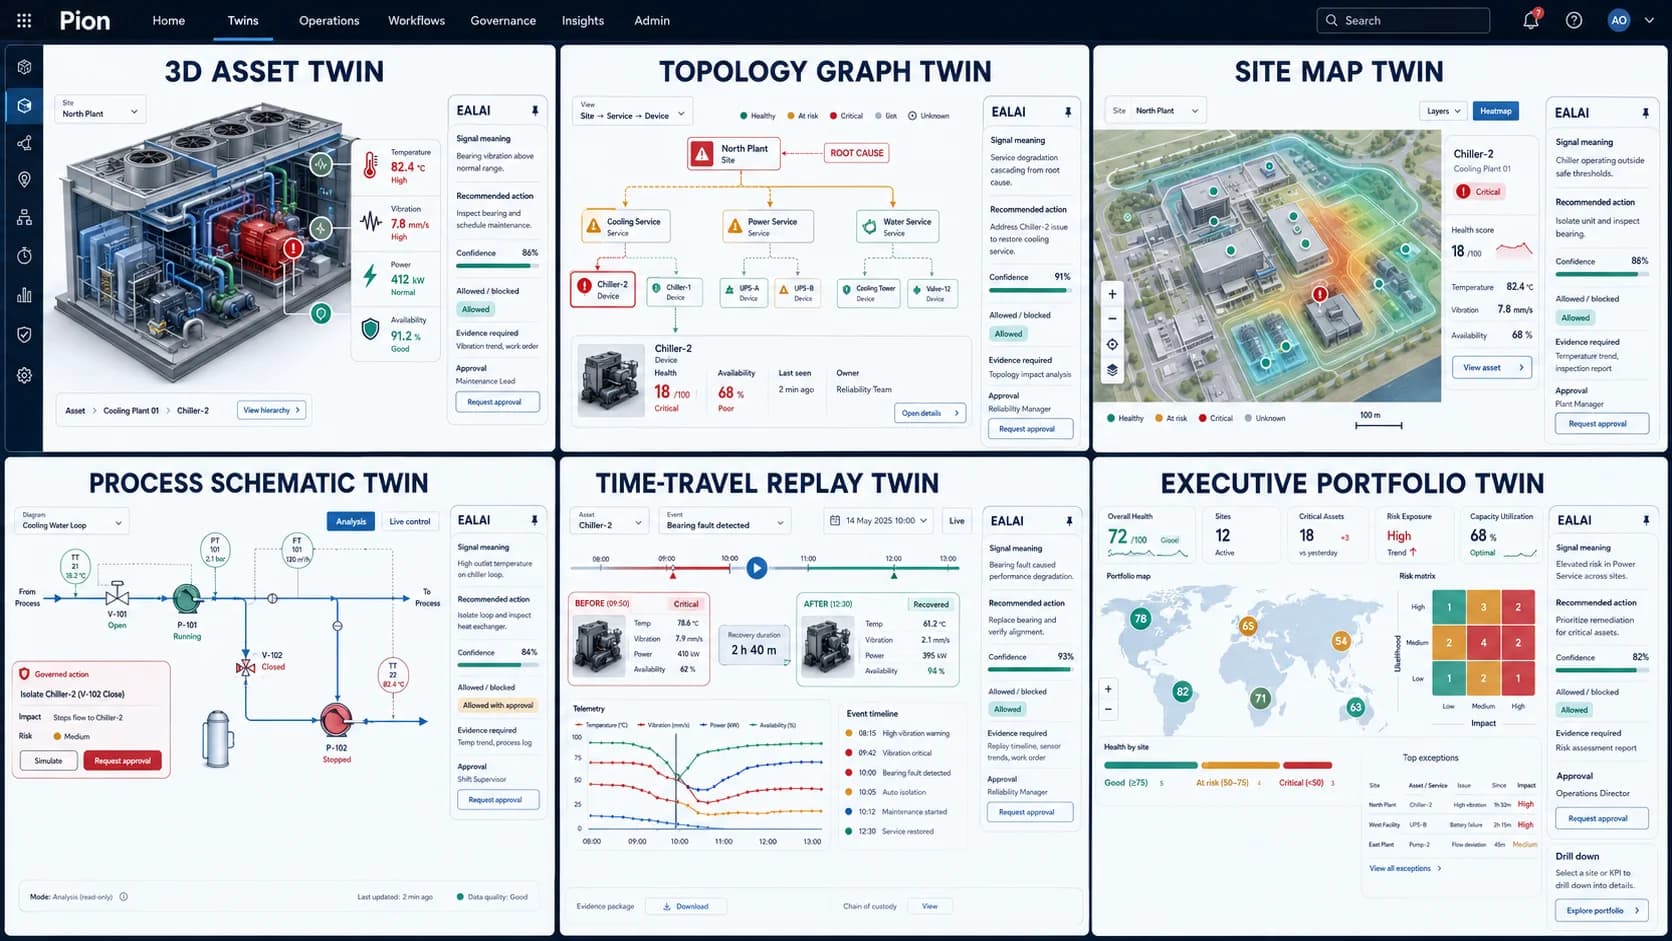
The panels show an EALAI reading beside each view — signal meaning, recommended action, a confidence score, and the approval it would need. The approval half is what the walkthrough on this site already runs. The rest of it is the destination: no predictive model runs in this stage, and confidence, horizon, wear and remaining useful life are not computed anywhere in the delivered platform.
This is NGCC5's list, unshortened. Each line is something a page is meant to be able to monitor, not something it monitors today: the audit finds no connected data source behind any of them, and each domain below carries the platform's own sentence naming what it does not yet do.
Not built in this stage · SIEM ingestion, endpoint detections, network and cloud findings
Not built in this stage · Availability and loop-health maths, interlock state, process trends
Not built in this stage · The predictive half: confidence, horizon, wear, remaining useful life
Not built in this stage · Patch compliance, backup success, device connectivity, OS inventory
04 / The platform today
Every screen below is the running platform, captured as it is. The label on each is the platform's own — green where every row is a record it wrote, amber where the estate is simulated. Nothing is asserted that the software does not compute.
One interface family, four operational domains
Each workspace presents the measurements, evidence, workflows, and controls appropriate to its operational role while preserving a common navigation model and a consistent EALAI interaction layer.
01 · Overview
Where attention is needed, and what this platform can and cannot do in this stage — both computed, neither asserted.
02 · Control Center
Every company in the simulated estate, down to the device — each level computed from the devices beneath it.
03 · SOC
Governed security actions and the platform's own records — requests, refusals, and tamper-evident chains.
04 · SCADA
The process view over the simulated estate — readings versus reference, cascades, and the governed path to act.
05 · Digital Twin
The model-to-physical comparison — each reading against the reference its record states. No predictive model runs in this stage.
06 · RMM
Every managed device in the simulated estate — health, last check-in, and the governed path to act on one.
07 · Reports
Decided records and the closeout packages they produce — each one verifiable by another party without trusting us.
08 · Settings
How this platform is configured, read from the running system — and why none of it can be changed from here yet.
09 · Authorization Gate
Governed decisions, evidence and closeout — step 11 and step 14 of the resolution path.
05 / The resolution path
NGCC5's own workflow: two ways in — from a functional page or from the map — and one governed way through.
ExampleAcme ManufacturingSacramento PlantSCADAProduction Line 2Pump P-204
EALAI retains company, site, system, device, evidence, permissions, and action context throughout the workflow.
06 / Evidence
Every decision writes an evidence record in the same database transaction as the decision itself — who decided, what, from which state to which, with a canonical snapshot of the request and both timestamps — linked to the record before it by a SHA-256 chain. The closeout export is a ZIP with a nine-part manifest, the decision, the chain, and a standalone verifier that runs on another machine with nothing but Python.
The chain
recordHash = SHA-256( canonical JSON of the record ‖ previous hash )
genesis prevHash = 0000000000000000000000000000000000000000000000000000000000000000
Canonical JSON — any deviation breaks every stored hash:
Honest limit · A same-database hash chain detects accidental corruption and unsophisticated edits. It does not survive an adversary who can rewrite the whole table and rehash. Real tamper evidence needs an external anchor — next stage.
The lifecycle
Five transitions are permitted; every other pair is refused with the record unchanged.
The requester never decides their own request, and every decision needs a written reason.
The closeout package
A ZIP with five files — re-checkable on another machine without this platform:
Its manifest has nine parts, in this order:
Part 9 — what this does not prove, as the package states it
07 / Built and not built
Both columns are the platform's own words — the same list its Overview page computes from.
Overview
Live records · simulated estateReads today
Every section below, plus the governed records behind them
Not built in this stage
No cross-period trends — no history is collected in this stage
Control Center
Simulated estate · live navigationReads today
The asset estate: company, site, system, device
Not built in this stage
No connector feeds the estate; the geography map stays on the legacy shell
SOC Operations
Governed records · telemetry not instrumentedReads today
Security requests, recorded refusals, chain integrity
Not built in this stage
SIEM ingestion, endpoint detections, network and cloud findings
SCADA Operations
Simulated estate · live governed requestsReads today
Systems, device readings, cascade dependencies
Not built in this stage
Availability and loop-health maths, interlock state, process trends
Digital Twin
Simulated estate · no predictive modelReads today
Readings against the references their records state
Not built in this stage
The predictive half: confidence, horizon, wear, remaining useful life
RMM Operations
Simulated estate · live governed requestsReads today
The managed fleet, its health and last check-in
Not built in this stage
Patch compliance, backup success, device connectivity, OS inventory
Reports
Live — governed recordsReads today
Decided records, their packages, chain integrity, recorded activity
Not built in this stage
Scheduled delivery, branded documents, period comparison
Settings
Live — read-only configurationReads today
The session, the approval policy the server enforces, and the boundaries
Not built in this stage
Every write: changing an authorization model is itself a governed action, and that path does not exist yet
Authorization Gate
Live — governed recordsReads today
The governed queue, decisions, transitions and evidence
| Section | Reads today | Not built in this stage |
|---|---|---|
| OverviewLive records · simulated estate | Every section below, plus the governed records behind them | No cross-period trends — no history is collected in this stage |
| Control CenterSimulated estate · live navigation | The asset estate: company, site, system, device | No connector feeds the estate; the geography map stays on the legacy shell |
| SOC OperationsGoverned records · telemetry not instrumented | Security requests, recorded refusals, chain integrity | SIEM ingestion, endpoint detections, network and cloud findings |
| SCADA OperationsSimulated estate · live governed requests | Systems, device readings, cascade dependencies | Availability and loop-health maths, interlock state, process trends |
| Digital TwinSimulated estate · no predictive model | Readings against the references their records state | The predictive half: confidence, horizon, wear, remaining useful life |
| RMM OperationsSimulated estate · live governed requests | The managed fleet, its health and last check-in | Patch compliance, backup success, device connectivity, OS inventory |
| ReportsLive — governed records | Decided records, their packages, chain integrity, recorded activity | Scheduled delivery, branded documents, period comparison |
| SettingsLive — read-only configuration | The session, the approval policy the server enforces, and the boundaries | Every write: changing an authorization model is itself a governed action, and that path does not exist yet |
| Authorization GateLive — governed records | The governed queue, decisions, transitions and evidence | — |
08 / Reporting
The platform's own list of what reporting is meant to produce. None of it is built in this stage beyond the closeout package: the Reports section's own words are quoted beside it.
The Reports section today
Reads: Decided records, their packages, chain integrity, recorded activity.
Not built in this stage: Scheduled delivery, branded documents, period comparison.
See it work
The interactive walkthrough runs the fourteen steps in your browser — with a real evidence chain you can verify and break — on sample data.